> For the complete documentation index, see [llms.txt](https://digitalgarden.batamladen.com/llms.txt). Markdown versions of documentation pages are available by appending `.md` to page URLs; this page is available as [Markdown](https://digitalgarden.batamladen.com/notes/machine-learning/learning-algorythm-types/unsupervised-ml/dbscan.md).
# DBscan
Clusters are dense regions in the data space, separated by regions of the lower density of points. The **DBSCAN algorithm** is based on this intuitive notion of “clusters” and “noise”. The key idea is that for each point of a cluster, the neighborhood of a given radius has to contain at least a minimum number of points.
## Parameters Required For DBSCAN Algorithm
1. **eps**: It defines the neighborhood around a data point. One way to find the eps value is based on the ***k-distance graph***.
eps area
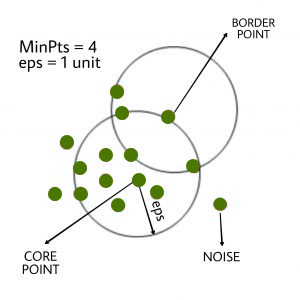
2. **MinPts**: Minimum number of neighbors (data points) within eps radius. As a general rule, the minimum MinPts can be derived from the number of dimensions D in the dataset as, MinPts >= D+1. The minimum value of MinPts must be chosen at least 3.
## Data points
In this algorithm, we have 3 types of data points.\
**Core Point**: A point is a core point if it has more than MinPts points within eps. \
**Border Point**: A point which has fewer than MinPts within eps but it is in the neighborhood of a core point. \
**Noise or outlier**: A point which is not a core point or border point.
***
## Example:
```python
import numpy as np
import matplotlib.pyplot as plt
from sklearn.datasets import make_moons
from sklearn.cluster import DBSCAN
# Generate synthetic moon-shaped data
X, _ = make_moons(n_samples=1000, noise=0.1, random_state=42)
# Apply DBSCAN clustering
dbscan = DBSCAN(eps=0.2, min_samples=5)
y_pred = dbscan.fit_predict(X)
# Plot the clusters
plt.figure(figsize=(8, 6))
plt.scatter(X[:, 0], X[:, 1], c=y_pred, cmap='viridis', marker='o', edgecolors='k')
plt.title('DBSCAN Clustering')
plt.xlabel('Feature 1')
plt.ylabel('Feature 2')
plt.show()
```
***
## Visualization
```python
import matplotlib.pyplot as plt #treba da se ispravi!!!
plt.scatter(X[:, 0], X[:, 1])
plt.show()
```
---
# Agent Instructions
This documentation is published with GitBook. GitBook is the documentation platform designed so that both humans and AI agents can read, navigate, and reason over technical content effectively. Learn more at gitbook.com.
## Querying This Documentation
If you need additional information that is not directly available in this page, you can query the documentation dynamically by asking a question.
Perform an HTTP GET request on the current page URL with the `ask` query parameter, and the optional `goal` query parameter:
```
GET https://digitalgarden.batamladen.com/notes/machine-learning/learning-algorythm-types/unsupervised-ml/dbscan.md?ask=&goal=
```
`ask` is the immediate question: it should be specific, self-contained, and written in natural language.
`goal` is optional and describes the broader end goal you are ultimately trying to accomplish on behalf of the user. GitBook uses it to tailor the answer towards what is most useful for that goal.
The response will contain a direct answer to the question and relevant excerpts and sources from the documentation.
Use this mechanism when the answer is not explicitly present in the current page, you need clarification or additional context, or you want to retrieve related documentation sections.